Linux perf:Linux 性能分析利器
目录:
Linux perf
Linux 性能分析
Linux 性能分析涉及到众多的计算机理论基础以及各式各样的性能分析工具,对于如何学习以及使用这些工具可以学习 brendangregg 大神的博客进行入门。
其中所涉及到的众多工具也可以总结为如下的一张图(建议设置为桌面):
本文主要介绍 perf 这一传统的 Linux 性能分析工具。
perf 简介
perf(Linux profiling with performance counters)是一个 Linux 性能分析工具,它基于事件采样的原理,以性能事件为基础,支持针对处理器相关性能指标与操作系统相关性能指标的性能剖析。可用于性能瓶颈的查找与热点代码的定位。
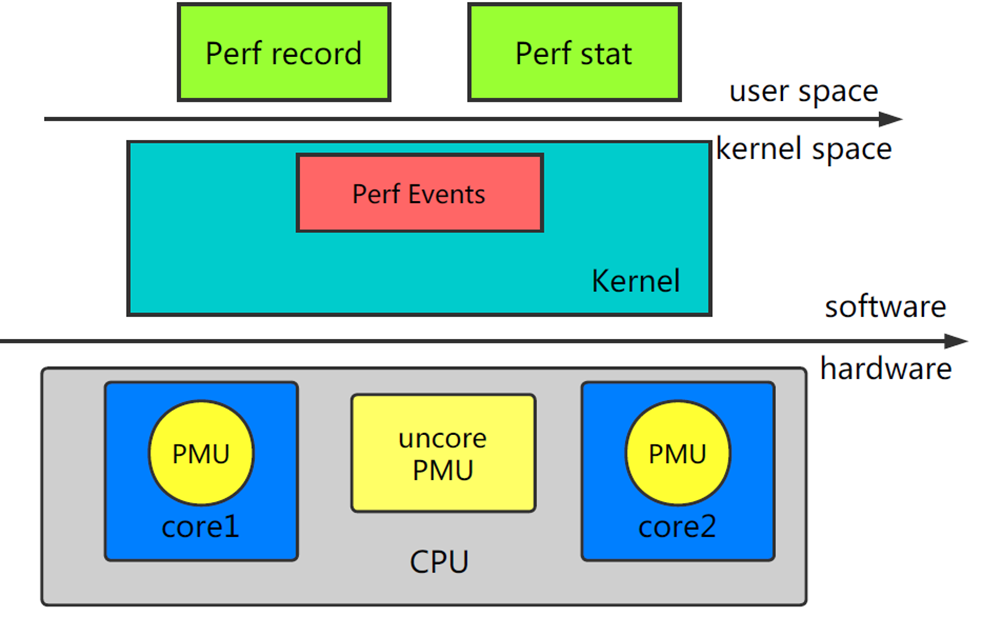
下图展示了Perf的整体架构:

Linux Perf 共由两部分组成:
Perf Tools:用户态的 Perf Tools 为用户提供了一系列丰富的工具集用于收集、分析性能数据。Perf Event Subsystem:Perf Event 子系统是内核众多子系统中的一员,其主要功能是和 Perf Tool 共同完成数据采集的工作。
Linux Perf 支持两种工作模式:
Counting Mode:将会精确统计一段时间内 CPU 相关硬件计数器数值的变化。为了统计用户感兴趣的事件,Perf Tool 将设置性能控制相关的寄存器。这些寄存器的值将在监控周期结束后被读出。典型工具:Perf StatSampling Mode:将以定期采样方式获取性能数据。PMU 计数器将为某些特定事件配置溢出周期。当计数器溢出时,相关数据,如 IP、通用寄存器、EFLAG 将会被捕捉到。典型工具:Perf Record
Perf 工具提供了一组丰富的命令来收集和分析性能和跟踪数据,通过一个通用的命令 perf,实现了一组子命令:
 usage: perf [--version] [--help] [OPTIONS] COMMAND [ARGS]

 The most commonly used perf commands are:
   annotate        Read perf.data (created by perf record) and display annotated code
   archive         Create archive with object files with build-ids found in perf.data file
   bench           General framework for benchmark suites
   buildid-cache   Manage build-id cache.
   buildid-list    List the buildids in a perf.data file
   c2c             Shared Data C2C/HITM Analyzer.
   config          Get and set variables in a configuration file.
   data            Data file related processing
   diff            Read perf.data files and display the differential profile
   evlist          List the event names in a perf.data file
   ftrace          simple wrapper for kernel's ftrace functionality
   inject          Filter to augment the events stream with additional information
   kallsyms        Searches running kernel for symbols
   kmem            Tool to trace/measure kernel memory properties
   kvm             Tool to trace/measure kvm guest os
   list            List all symbolic event types
   lock            Analyze lock events
   mem             Profile memory accesses
   record          Run a command and record its profile into perf.data
   report          Read perf.data (created by perf record) and display the profile
   sched           Tool to trace/measure scheduler properties (latencies)
   script          Read perf.data (created by perf record) and display trace output
   stat            Run a command and gather performance counter statistics
   test            Runs sanity tests.
   timechart       Tool to visualize total system behavior during a workload
   top             System profiling tool.
   probe           Define new dynamic tracepoints
   trace           strace inspired tool
perf 安装
在 Ubuntu 中安装 perf:
# 首先安装 linux-tools-common
$ sudo apt-get install linux-tools-common

# 然后根据提示安装对应内核版本的工具
$ sudo apt install linux-tools-4.18.0-22-generic
在 Centos 中安装 perf:
$ sudo yum install perf
perf 使用
Linux 性能问题分析主要分为两大类:

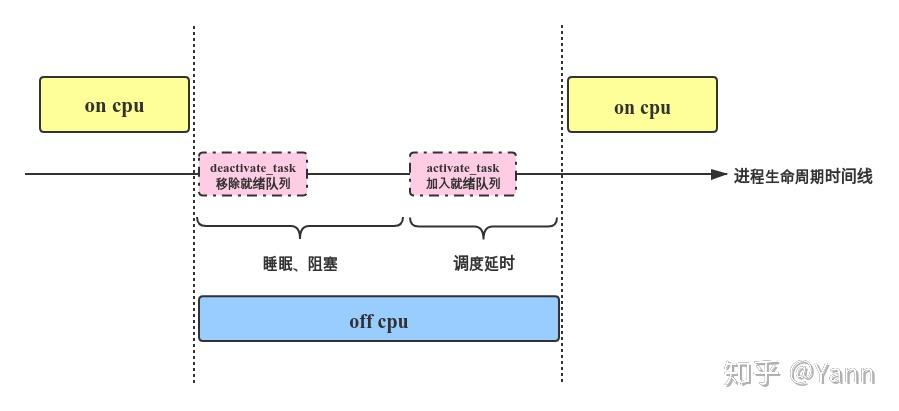
oncpu:进程获得 cpu 使用权的时间产生的问题。offcpu:进程失去 cpu 使用权时度过的时间产生的问题。
进程什么时候让出 cpu 或被让出 cpu 呢?主要包括以下几种情况:
voluntary:包括IO阻塞、等待mutex锁睡眠、主动睡眠等,这些情况会导致进程task_struct->state切换为非 RUNNING,再由deactivate_task()从就绪队列移除,然后通过context_switch让出CPU,接下来的便是等待被 wakeup。当进程满足被唤醒的条件被 wakeup,activate_task()会将进程重新加入就绪队列,但其并不代表能马上被调度,进入就绪队列再到被真正执行的时间即上图的调度延时。involuntary: 即进程被抢占。这种情况下进程状态保持为 RUNNING,在合适的抢占时机通过context_swtich()让出 CPU 给高优先级进程。从被动让出 CPU 到再次被选择调度的这个时间被称为调度延时,同样属于 off cpu 时间。
针对这些 cpu 运行期间发生的问题就可以使用 perf 来采集相关数据来分析问题,分析问题的流程主要包括:采集数据 -> 解析数据 -> 分析数据 -> 定位问题 -> 解决问题。这里主要介绍如何使用 perf 来采集数据和解析数据。
采集数据
命令:perf record
使用方式:
$ sudo perf record -F {频率} -p {pid} -e {event} -g sleep {定时执行时间,单位秒}
分析 oncpu 问题的时候不需要设置 -e 选项。
常见 offcpu 对应的 event:
sched:sched_switch
sched:sched_stat_sleep
sched:sched_stat_iowait
sched:sched_stat_blocked
sched:sched_stat_wait
sched:sched_stat_runtime
sched:sched_process_fork
sched:sched_wakeup
sched:sched_wakeup_new
sched:sched_migrate_task
分析数据
分析数据主要需要两个 perf 的命令以及对应的热力图项目(https://github.com/brendangregg/FlameGraph)。
命令:perf report:分析采集的 perf 数据
使用方式:
$ sudo perf report -i perf.data
命令:perf script:将采集到的数据转为可读模式,输出对应的调用栈信息
使用方式:
sudo perf script -i perf.data > perf.unfold
但是这样直接使用 perf script 进行解析的话会由于 perf 的数据量很大导致无法找到所需的数据,因此很多情况下都是需要对 perf 数据进行过滤的,过滤对应脚本:
# process perf data(simplify data)
import datetime
import os
import time

_PERF_SCRIPT_CMD = "sudo perf script -i {} -f > {}"


def get_kboot_time():
    with open("/proc/stat") as f:
        for line in f:
            if 'btime' in line:
                return datetime.datetime.fromtimestamp(int(line.split()[1]))


def us_to_ust_time(ts):
    utc_time = get_kboot_time() + datetime.timedelta(
        seconds=ts / 1000000)  # unit: s
    utc_timestamp = time.mktime(
        time.strptime(utc_time.strftime("%Y-%m-%d %H:%M:%S.%f"),
                      "%Y-%m-%d %H:%M:%S.%f"))
    return int(utc_timestamp), utc_time.strftime("%Y-%m-%d %H:%M:%S.%f")


def simplify_perf_data(is_simplify, old_file, new_file, pname, pid, start_time,
                       end_time):
    with open(old_file, "r") as f:
        with open(new_file, "w") as new_f:
            line = f.readline()
            while line:
                if not is_simplify:
                    new_f.write(line)
                    line = f.readline()
                    continue

                # start simplify.
                if line.startswith(pname):
                    line_data = line.split()
                    if len(line_data) == 5 and line_data[1] == pid:
                        data_timestamp, data_time = us_to_ust_time(
                            float(line_data[2][:len(line_data[2]) - 1]) *
                            1000000)
                        if data_timestamp >= start_time and data_timestamp <= end_time:
                            new_f.write(line)
                            line = f.readline()
                            while not line.startswith(pname):
                                new_f.write(line)
                                line = f.readline()
                        else:
                            line = f.readline()
                    else:
                        line = f.readline()
                else:
                    line = f.readline()


def process_perf_data(perf_data_path, is_simplify, pname, pid, start_time,
                      end_time):
    perf_unfold_file_path = "./data/perf.unfold"
    perf_unfold_file_simplify_path = "./data/perf-simplify.unfold"

    # perf script.
    os.system(_PERF_SCRIPT_CMD.format(perf_data_path, perf_unfold_file_path))

    # simplify perf data.
    simplify_perf_data(is_simplify, perf_unfold_file_path,
                       perf_unfold_file_simplify_path, pname, pid, start_time,
                       end_time)

# example
process_perf_data("./data/perf.data", True, "test", "10086",
                  1661408600, 1661408600)
这样精简数据之后便可以使用热力图项目输出对应的热力图进行问题分析:
# 热力图方式进行展示(需下载FlameGraph源码)
/home/pilot/Projects/FlameGraph/stackcollapse-perf.pl perf.unfold &> perf.folded
/home/pilot/Projects/FlameGraph/flamegraph.pl perf.folded > out.svg
